Upload a chart. Get every pattern found, drawn, and explained.
VisionTradeAI reads a screenshot of any stock chart, detects the technical patterns that are genuinely visible in it, and hands it back annotated — with confidence scores and plain-English explanations for each one.
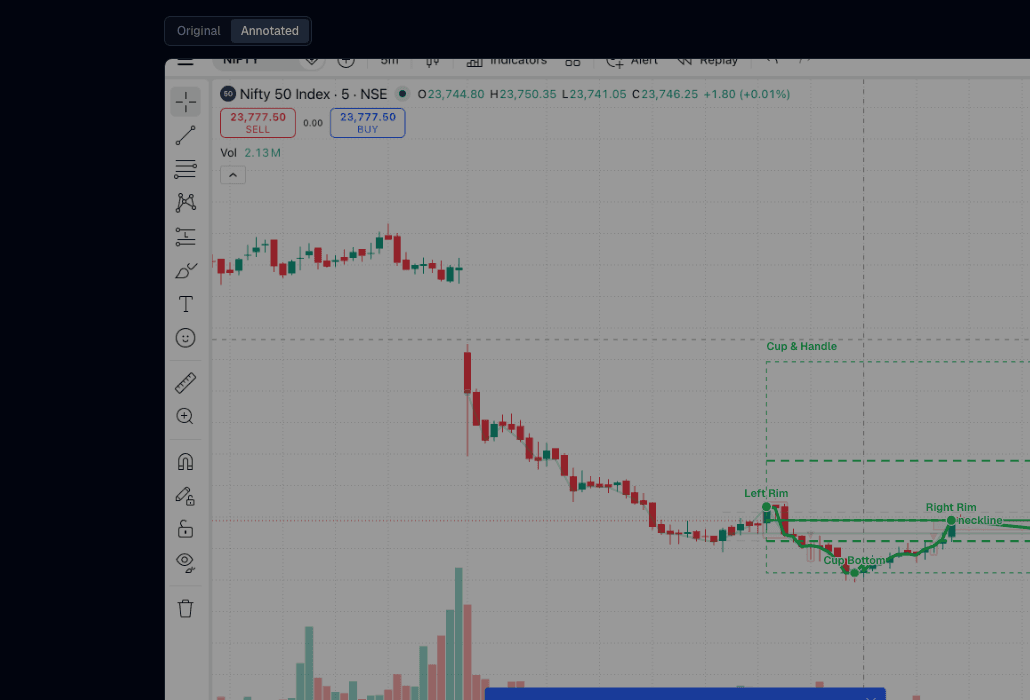
A real upload — click any detected pattern in the app for this same labelled breakdown.
How it works
Upload a screenshot
Drop in a chart from TradingView, Zerodha, Groww, or anywhere else — PNG or JPEG.
Computer vision reads the candles
The chart area, candle colors, and price axis are detected automatically, then reconstructed into real OHLC data.
Every pattern gets tested
20+ classical setups — head & shoulders, triangles, wedges, cup & handle, candlesticks, gaps — each scored on its own geometry.
AI validates and explains
Gemini checks each candidate against the actual image, rejects weak ones, and writes a plain-English explanation for what's left.
Patterns it knows how to find
Plus double/triple tops & bottoms, rounding formations, rectangles, channels, diamonds, gaps, Fibonacci levels, and the major candlestick reversals — only drawn when they're genuinely there.
Head & Shoulders
BearishThree peaks in a row, the middle one clearly higher than the two either side, which sit at roughly the same height.
A classic warning that an uptrend may be running out of steam and reversing lower.
Double Top
BearishTwo peaks at roughly the same height, forming a shape like the letter M.
Two failed attempts at the same resistance level often mark a top.
Double Bottom
BullishTwo troughs at roughly the same depth, forming a shape like the letter W.
Two failed attempts to break the same support level often mark a bottom.
Cup & Handle
BullishA rounded, U-shaped dip and recovery, followed by a small shallow pullback near the top.
A pause-and-continue pattern — the earlier uptrend often resumes.
Ascending Triangle
BullishA flat resistance line on top with a rising line of higher lows underneath.
Buyers stepping in at higher prices while sellers defend one ceiling — often breaks up.
Falling Wedge
BullishBoth boundaries slope downward, narrowing, while the whole pattern drifts lower.
Weakening downward momentum inside the wedge — often reverses higher.
Bull Flag
BullishA sharp rally, followed by a brief, tight, slightly downward-drifting pause.
A short pause after a strong move up — the rally often continues.
Rounding Bottom
BullishA slow, gradual, bowl-shaped dip and recovery, forming over a longer stretch of the chart.
A gentle, long-term shift from sellers to buyers being in control.
See what's in your own charts
Free to start. No credit card, just an email and password — or sign in with Google.
Get Started Free